Ski Areas Indifferent to El Nino/La Nina (as of 2023)
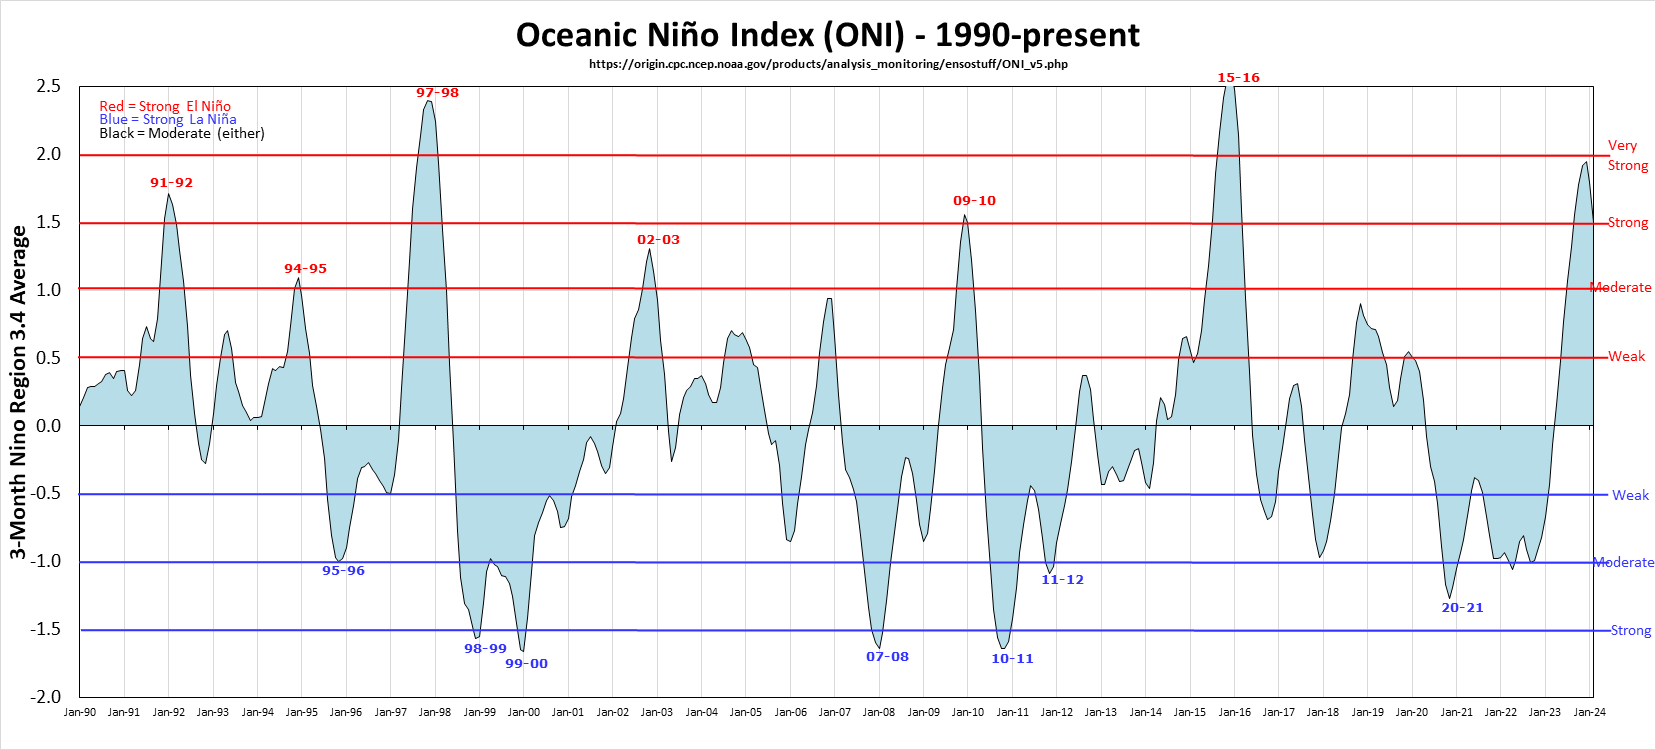
On my El Nino page I introduced the Multivariate ENSO Index and the Oceanic Nino Index , which are overall measures of the strength of El Nino/La Nina. The more widely used ONI since 1990 is graphed here for convenience.
When I first wrote this article on 11/21/07 the last posted value of MEI was
-1.117 for SEP/OCT 2007 (also -1.1 for ASO ONI), and I expressed strong confidence
that the observed La Nina condition would be in effect through the
end of 2007, and some confidence that it would persist for the
entire 2007-08 ski season. It turned out that La Nina remained strong (2007-08 was 5th
highest La Nina by MEI and 3rd highest by ONI in the past 50 years) through FEB/MAR, then
dissipated to near neutral by MAY/JUN for MEI and a couple months later for ONI.
Similarly the El Nino of 2009-10 was strong through FEB/MAR
(the 7th highest El Nino in the past 50 years by both indicies), but both turned negative
by June. By AUG/SEP 2010 MEI registered -1.88, the strongest La
Nina reading since 1974, and ONI reached -1.6 in October. The La Nina of 2010-11 remained
strong through April (the 3rd highest by MEI and 6th by ONI in the past 50 years) before weakening
in late spring. La Nina strengthened to a moderate level by
fall 2011 and gradually weakened the following spring. The MEI Index did
not have a sustained significant El Nino or La Nina stretch for the next 3 ski seasons.
From late spring 2015 to early spring 2016 El Nino exceeded +2.0 for 9 months by MEI and 6
months by ONI and was the highest overall by ONI and 3rd highest by MEI in the past 50 years.
The 2015-16 El Nino ended abruptly in June 2016. The northern spring months are the historically
most likely time for an El Nino or La Nina to break up, as occurred for all 7 events
from 2007-2024. There were no material El Nino or
La Nina deviations in the MEI or ONI indices from 2017-2020 aside from a mild La Nina in early 2018
and a borderline El Nino in early 2019, so I did not update the data presented here until after
the moderate La Nina of 2020-21. That La Nina persisted for 3 seasons into early 2023 but the two
indices diverged during 2022-23 when La Nina remained consistent by ONI while strengthening
by MEI. The La Nina dissipated by early spring for both but the ensuing 2023-24 El Nino topped out at
+2.0 by ONI but only +1.1 by MEI. The recent El Nino has weakened but as of MJJ 2024 the ONI is still +0.2,
though the MEI is now moderate La Nina at -0.7.
In recent years most meteorologists are using the ONI, so I'm doing that too as of 2023. Since 1950
monthly ONI is 88% correlated to monthly MEI and ski season values are 94% correlated. The
relationship of ski area snowfall to El Nino/La Nina is essentially the same for both MEI and ONI,
The tables of ski areas insensitive to El Nino/La Nina below are calculated using ONI, and all of these ski areas have
the same classification using MEI.
I have
correlated the Monthly ONI Table with all of the monthly snowfall
data I have collected through 2023. The list of ski areas insensitive to El Nino/La Nina,
along with their monthly and season correlations to the ONI index
and average snowfall during strong El Nino and La Nina months, is shown below:
Note that there are 57 areas
listed here, vs. 9 that are favored by El Nino and 36 favored by
La Nina. In particular, with the exceptions of Brian Head and
Steamboat El Nino/La Nina have minimal predictive value for Utah
and Colorado ski areas. Overall Utah asatch snowfall
during strong La Nina months exceeds snowfall during strong El Nino
months by arpund 10%, which is a borderline call given only
25-45 months in each strong category. Data volatility is even
more evident for Crested Butte and Snowmass being moved to mild
La Nina due to 18% excess snowfall in the strong La Nina months.
At nearby Aspen Mt. the La Nina over El Nino snowfall
excess is an insignificant 5%. In the El Nino favored page I analyzed the data from
Donner Pass near Lake Tahoe and Mammoth, illustrating that Sierra snowfall
is not as sensitive to El Nino as most people think. Note here
that for all the Tahoe areas both strong El Nino and strong La Nina
months average close to each other and to 100% of normal. The most
southwestern locations in Colorado like Purgatory, Telluride
and Red Mt. Pass (also presumed by many to be favored by El
Nino) have even smaller correlations than the Lake
Tahoe areas along with similar averages in the strong El Nino and
La Nina months. Most of these southwestern locations had record snowfall
during the strong La Nina of 2007-08. Many Sierra areas had record
snowfalls during the La Ninas of 2010-11 and 2022-23. Most Northern Rockies
areas are favored by La Nina, but there are a few microclimates
that are less sensitive. Sun Valley and Sun Peaks have fairly dry
climates that are blocked out of some prevailing weather patterns.
It is well known that Sun Valley gets its biggest dumps from the south,
and the strong El Nino of 1983 was its second highest snow season.
Red Mt. is perhaps the biggest surprise, as it shows little sensitivity
by either correlation or strong El Nina/La Nina months, yet it is surrounded
by areas that all favor La Nina quite strongly. In the La Nina favored page I noted that the Whistler
alpine and New Zealand are not as sensitive to La Nina as many
people assume. And finally, the Northeast is
minimally affected by El Nino/La Nina, with a few scattered
anomalies favored by La Nina, of which Cannon Mt. is the strongest. The contrasting 2010-11 and 2011-12
La Nina seasons drive home the irrelevance of El Nino/La Nina to these regions.
Tahoe, Utah and I-70 Colorado all had huge seasons in 2010-11 and severe
drought seasons in 2011-12. I-70 Colorado in particular had some record
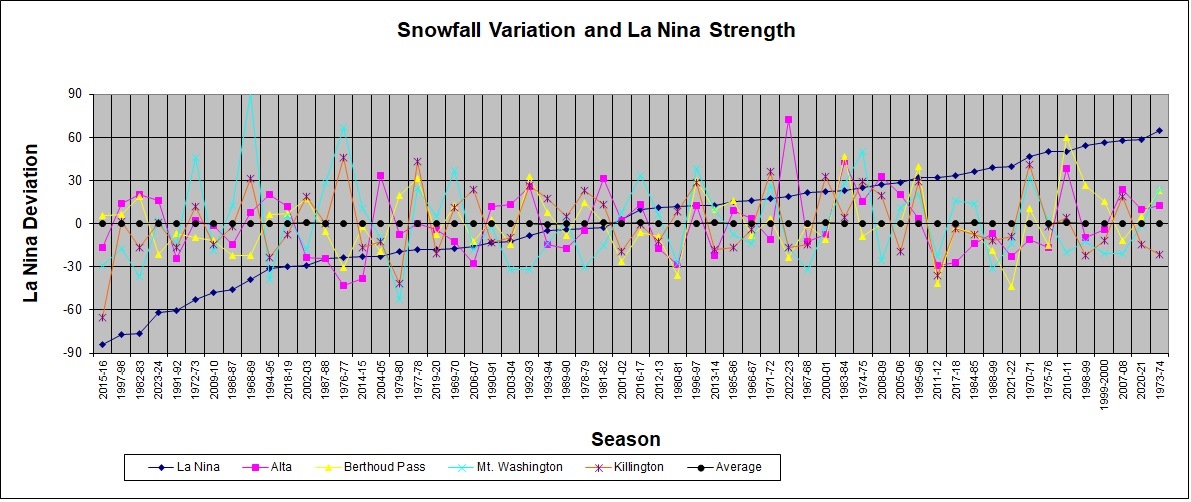
high snowfalls in 2010-11 and some record lows in 2011-12. I have constructed graphs to
illustrate the variability of the snowfall correlations to El
Nino/La Nina. The one below is for selected areas with
minimal sensitivity to El Nino/La Nina. The
horizontal axis lists all the past ski seasons since 1966-67 in order of strong El Nino at
left to strong La Nina at right according to ONI. The vertical axis
is percent deviation from normal snowfall. The blue line is the sum
of ONI indices from OND to MAM, scaled to fit the graph. The areas above were selected
for complete data since 1966-67. Berthoud Pass (yellow line) is a good
representative for the numerous areas along the I-70 corridor in
Colorado, ranging west to Aspen.
Killington (orange) and Mt. Washington (light blue) represent a couple of climate zones
in the Northeast. If you look at the 8 strongest
El Nino and La Nina seasons, Alta (purple), Berthoud, Mt. Washington
and Killington all have at least 2 above average seasons and 2 below
average seasons in each group. Overall the graph shows
why El Nino and La Nina do not predict snowfall well for the 57
areas listed in the Minimal Sensitivity list above.
Area
Monthly
Seasonal
Seasons
Strong
Strong
El Nino
La Nina
Minimal
sensitivity to El Nino/La Nina
Squaw Valley, Calif. 6,200
-0.6%
-22.7%
34
118%
103%
Sugar Bowl, Calif. 7,000
2.0%
110%
102%
Central Sierra Snow Lab - Boreal, Cal.
7,200
2.9%
9.0%
57
109%
101%
Alpine Meadows, Calif. 7,000
2.7%
5.3%
54
107%
100%
Mt. Rose, Nev. 8,600
1.1%
3.1%
107%
103%
Monarch, Colo.
4.3%
21.8%
21
98%
94%
Wolf Creek, Colo. 10,672
2.7%
25.9%
23
99%
96%
Red Mt. Pass, Colo. 11,090
3.5%
6.7%
34
103%
103%
Telluride, Colo. 11,171
1.9%
103%
101%
Kirkwood (Carson Pass), Calif. 8,526
0.0%
2.6%
50
101%
99%
Alyeska, Alaska 1,400
0.3%
-1.9%
42
107%
99%
Purgatory, Colo. 10,000
0.4%
94%
95%
Squaw Valley, Calif. 8,000
2.8%
94%
100%
Remarkables, New Zealand 5,203
2.8%
-4.4%
Mt. Hutt, New Zealand 4,602
2.3%
1.9%
Snowshoe, W. V. 4,849
5.3%
87%
96%
Sugarloaf, Maine 3,715
1.6%
9.5%
58
Mt. Washington, B. C. 3,926
2.2%
Blackcomb, B. C. 5,002
1.0%
-3.8%
17
Heavenly Valley, Calif. 8,400
-0.8%
5.6%
32
102%
100%
Sun Valley, Idaho 8,800
-0.8%
99%
99%
Red Mt. 2, B. C. 6,680
-0.6%
99%
102%
Northstar, Calif. 7,800
-2.2%
98%
105%
Coronet Peak, New Zealand 4,032
-2.9%
Killington, Vt. 4,142
-3.5%
-10.4%
58
99%
97%
Mt. Washington, N. H. 6,263
-1.4%
-3.3%
58
105%
98%
Sun Peaks, B. C. 6,100
-4.4%
92%
95%
Aspen Mtn, Colo. 11,190
-3.7%
95%
98%
Arapahoe Basin, Colo. 10,820
-2.8%
-1.9%
37
97%
104%
Loveland, Colo. 11,200
-3.0%
-5.4%
43
96%
103%
Whistler Roundhouse, B. C. 6,000
-3.5%
-7.5%
45
102%
107%
Mary Jane at Winter Park, Colo. 10,800
-4.1%
-2.1%
49
96%
104%
Keystone, Colo. 11,671
-4.6%
9.6%
25
95%
100%
Winter Park Base, Colo. 9,268
-6.4%
-8.7%
15
Brighton, Utah 8,740
-7.3%
-9.0%
19
96%
101%
Sugarbush, Vt. 3,000
-8.5%
-11.0%
37
84%
89%
Mt. Snow, Vt. 3,600
-5.9%
Snowbird, Utah 8,100
-6.1%
-2.1%
45
94%
103%
Berthoud Pass, Colo. 11,315
-5.2%
-5.9%
50
95%
103%
Big White, B. C. 6,200
-7.3%
-17.9%
39
86%
93%
Snow Basin, Utah 7,710
-7.6%
7.1%
28
95%
104%
Beaver Creek, Colo. 11,200
-4.8%
94%
103%
Alta Guard UDOT, Utah 8,680
-6.1%
-6.9%
57
92%
101%
Vail, Colo.
11,250
-6.9%
-8.9%
30
96%
104%
Sunlight, Colo.
-11.0%
Park City 2, Utah 9,280
-7.7%
-2.1%
46
94%
104%
Aspen Highlands, Colo. 11,100
-10.3%
98%
106%
Stratton, Vt. 3,875
-7.7%
-10.9%
34
87%
96%
Copper Mtn, Colo. 11,000
-10.3%
-22.0%
27
93%
103%
Jupiter Bowl, Utah 10,000
-9.8%
-3.7%
36
96%
108%
Waterville Valley, N. H. 3,000
-10.4%
87%
96%
Gothic, Colo. 9,400
-6.0%
-9.7%
50
90%
103%
Deer Valley, Utah 8,200
-16.9%