Ski Areas Favored by La Nina (as of 2023)
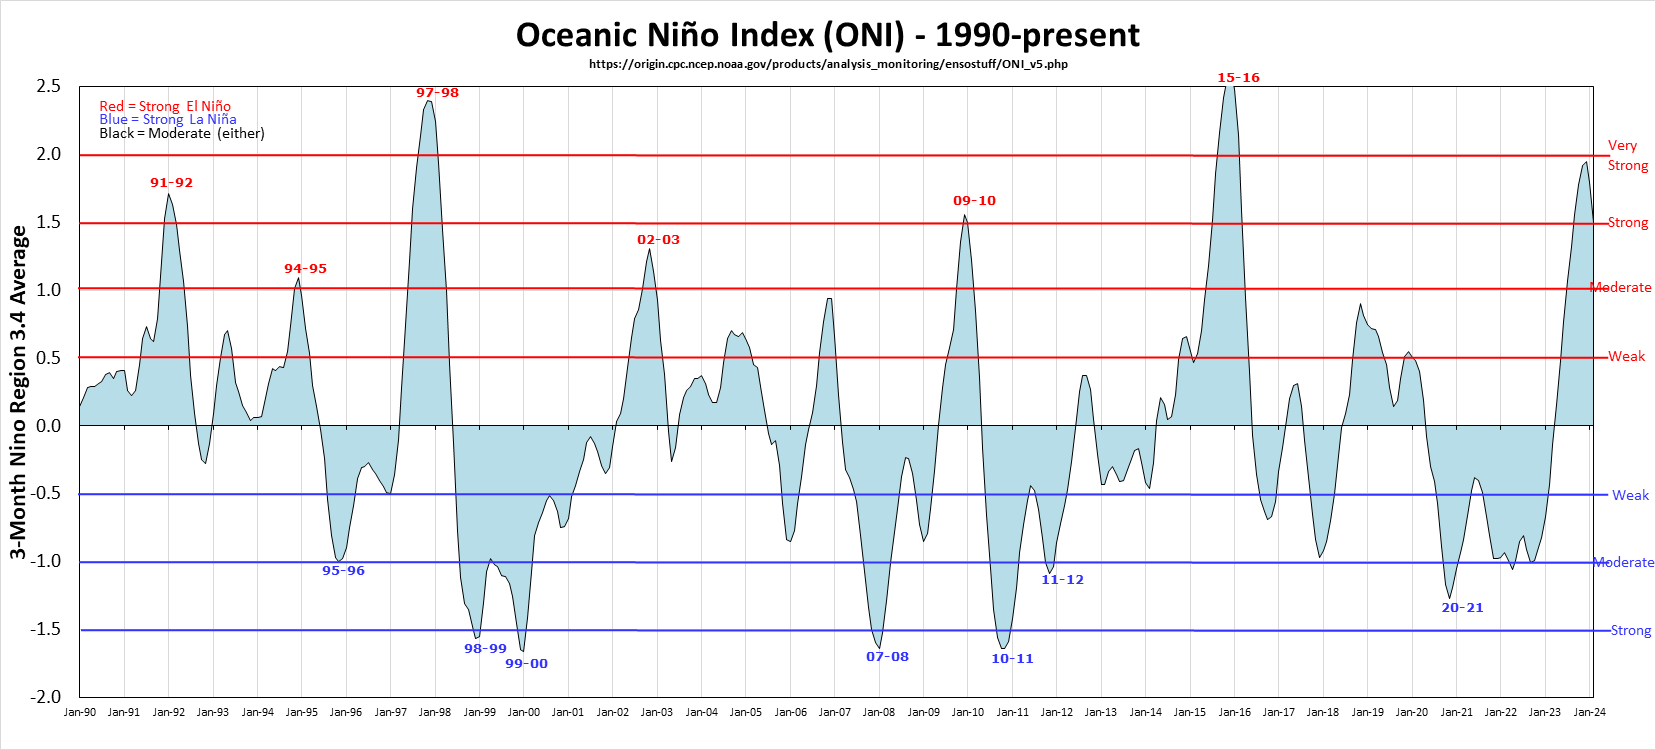
On my El Nino page I introduced the Multivariate ENSO Index and the Oceanic Nino Index , which are overall measures of the strength of El Nino/La Nina. The more widely used ONI since 1990 is graphed here for convenience.
When I first wrote this article on 11/21/07 the last posted value of MEI was
-1.117 for SEP/OCT 2007 (also -1.1 for ASO ONI), and I expressed strong confidence
that the observed La Nina condition would be in effect through the
end of 2007, and some confidence that it would persist for the
entire 2007-08 ski season. It turned out that La Nina remained strong (2007-08 was 5th
highest La Nina by MEI and 3rd highest by ONI in the past 50 years) through FEB/MAR, then
dissipated to near neutral by MAY/JUN for MEI and a couple months later for ONI.
Similarly the El Nino of 2009-10 was strong through FEB/MAR
(the 7th highest El Nino in the past 50 years by both indicies), but both turned negative
by June. By AUG/SEP 2010 MEI registered -1.88, the strongest La
Nina reading since 1974, and ONI reached -1.6 in October. The La Nina of 2010-11 remained
strong through April (the 3rd highest by MEI and 6th by ONI in the past 50 years) before weakening
in late spring. La Nina strengthened to a moderate level by
fall 2011 and gradually weakened the following spring. The MEI Index did
not have a sustained significant El Nino or La Nina stretch for the next 3 ski seasons.
From late spring 2015 to early spring 2016 El Nino exceeded +2.0 for 9 months by MEI and 6
months by ONI and was the highest overall by ONI and 3rd highest by MEI in the past 50 years.
The 2015-16 El Nino ended abruptly in June 2016. The northern spring months are the historically
most likely time for an El Nino or La Nina to break up, as occurred for all 7 events
from 2007-2024. There were no material El Nino or
La Nina deviations in the MEI or ONI indices from 2017-2020 aside from a mild La Nina in early 2018
and a borderline El Nino in early 2019, so I did not update the data presented here until after
the moderate La Nina of 2020-21. That La Nina persisted for 3 seasons into early 2023 but the two
indices diverged during 2022-23 when La Nina remained consistent by ONI while strengthening
by MEI. The La Nina dissipated by early spring for both but the ensuing 2023-24 El Nino topped out at
+2.0 by ONI but only +1.1 by MEI. The recent El Nino has weakened but as of MJJ 2024 the ONI is still +0.2,
though the MEI is now moderate La Nina at -0.7.
In recent years most meteorologists are using the ONI, so I'm doing that too as of 2023. Since 1950
monthly ONI is 88% correlated to monthly MEI and ski season values are 94% correlated. The
relationship of ski area snowfall to El Nino/La Nina is essentially the same for both MEI and ONI,
The tables of La Nina favored areas below are calculated using ONI, and all of these ski areas have
the same classification using MEI.
I have
correlated the Monthly ONI Table with all of the monthly snowfall
data I have collected through 2023. The list of ski areas favored by La Nina,
along with their monthly and season correlations to the ONI index
and average snowfall during strong El Nino and La Nina months, is shown below:
Recall from
before that these correlations fit with observed experience that in big El
Nino or La Nina years the expected effects occur from time to time but not
consistently. So I considered the seasonal correlations to be the main criteria
in classifying areas, and it is important to remember that season
correlations based upon 20-60 data points have some uncertainty. The snowfall
data for strong El Nino and La Nina months, added in 2013, has caused me to
classify a few more areas as mildly favored by La Nina. These tend to have only
mildly negative correlations but snowfall during strong La Nina months exceeds
snowfall during strong El Nino months by 15-20%. At most of the strongly favored
areas snowfall during strong La Nina months exceeds snowfall during strong El Nino
months by 30% or more. La Nina
strongly favors Washington State and inland areas ranging as far north as Revelstoke/Banff
in Canada and as far south as Jackson Hole. Oregon and Colorado's farthest
north area Steamboat are mildly favored, and there are scattered areas in the
Northern Rockies of both U.S. and Canada that are only mildly or minimally
affected. I was somewhat surprised that the snowiest Vermont areas (Jay,
Smuggler's Notch, Stowe) are mildly favored by La Nina, while most other
eastern areas are minimally affected. The other
surprise is that coastal British Columbia is not that sensitive. The exception is
Whistler base which had huge snow during the big La Nina years of the early 1970's.
It has not done so well during more recent La Ninas due to global warming effects
of more rain at its low 2,000 foot elevation. Whistler shows minimal La Nina sensitivity
up at 5,000 or 6,000 feet, and the same is true for Mt. Washington on Vancouver Island at 4,000.
Note on the El Nino page that
the Valdez/Thompson Pass area of Alaska slightly favors El Nino. Australia/New Zealand have been reputed to be
favored by La Nina, but in 2006 I acquired data for 3 South Island New Zealand areas that show little El
Nino/La Nina impact. Spencer's Creek (near Thredbo and Perisher Blue ski areas) snowpack data does
show that Australia is mildly favored by La Nina. In La Nina
years the favored Northwest and Northern Rockies resorts are
generally more likely to be covered by Christmas as well as getting extra snow
through the season. November 2007 was not as strong as other La
Nina early seasons, but these areas ended up above average for the 2007-08 season
as a whole including record snowfall at 5 of them. In El Nino
years my general advice to avoid advance bookings until sufficient snow is on
the ground should be taken more seriously at these areas, particularly where
average snowfall is modest and there is less margin for error. High snow
areas like Jackson, Fernie and Steamboat are probably still just fine during
their normally prime months of January and February. In 2010-11
and 2011-12 we had 2 contrasting La Nina seasons. 2010-11 was the overall
best natural snow season in North America in at least 40 years while 2011-12
was the worst in 20 years. However the La Nina favored regions were the ones
that escaped drought in 2011-12. The Pacific Northwest and western Canada had
strong seasons and the U.S. Northern Rockies were only slightly below average. I have
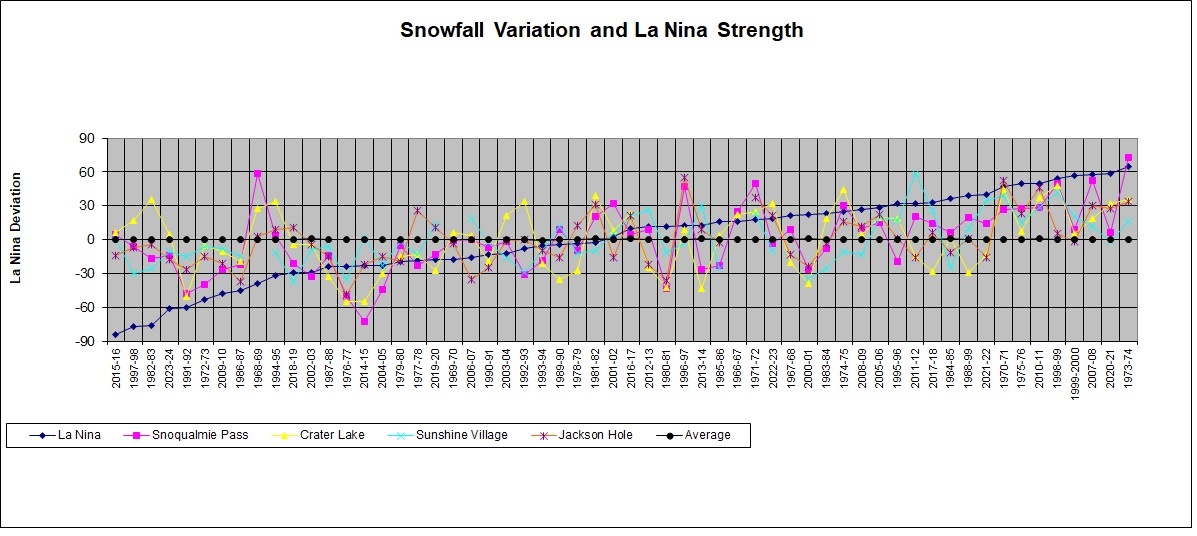
constructed graphs to illustrate the variability of the snowfall
correlations to El Nino/La Nina. The one below is for selected areas
favorable to La Nina. The
horizontal axis lists all the past ski seasons since 1966-67 in order of strong El Nino at
left to strong La Nina at right according to ONI. The vertical axis
is percent deviation from normal snowfall. The blue line is the sum
of ONI indices from OND to MAM, scaled to fit the graph. For Washington
and Oregon I selected the Snoqualmie Pass (purple line) and Crater Lake (yellow
line) data because it was complete since 1966-67. Crater Lake is close to Mt.
Bailey snowcat skiing and a couple of hours drive from Mt. Bachelor ski
area. Jackson Hole (orange line) and Sunshine Village (light blue line)
are good representative ski areas for the Northern Rockies of the U.S. and Canada respectively. Results are
quite consistent for these 4 areas in the strong La Nina seasons. All 4
areas are above average in the top 8 La Nina years except for Sunshine at
98% in 1988-89 and Jackson at 98% in 1999-2000. In the highest year 1973-74
and 3rd highest 2007-08, 3 of the 4 selected areas were over 130% of normal snowfall.
In the 4th highest 1998-99, 3 of the 4 areas were over 140%. Average snowfall at all
4 areas over these 8 years is about 125% of normal At Snoqualmie,
Jackson and Sunshine the top 6 El Nino seasons through 2010 and 2023-24 were all below
average. Average snowfall at all 3 areas over these 7 years was about 85% of normal, and the worst
case was Jackson at 63% in 1986-87. The 2015-16 El Nino was the exception, with Snoqualmie
at 104% of normal, and there were many other Northwest and western Canadian
areas at or above average. Crater Lake deviated from the expected pattern,
with 131% and 113% snowfall in the 2 big El Nino years of 1982-83 and
1997-98, and 104% in 4th highest 2023-24. Crater Lake was also 130% in the
9th and 11th highest El Ninos of 1968-69 and 1994-95. We should remember that
Crater Lake and Mt. Bachelor are in the middle of Oregon, and that Mt. Hood is next to
Washington State and similarly favored by La Nina. But the
mixed results from Crater Lake should remind us that the "mildly favored"
areas listed above will have less consistent El Nino/La Nina impact than the
"strongly favored" areas like Mt. Rainier, Jackson and Sunshine. Ski Areas Indifferent to El Nino/La Nina
Area
Monthly
Seasonal
Seasons
Strong
Strong
El Nino
La Nina
Strongly
favored by La Nina
Snoqualmie Pass, Wash. 3,000
-22.6%
-52.9%
58
82%
119%
Whistler Base, B. C. 2,200
-19.5%
-32.2%
39
89%
123%
Whitefish, Mont. 6,710
-23.3%
78%
110%
Castle Mt., Alb. 5,710
-24.5%
87%
117%
Silver Star, B. C. 5,200
-23.8%
-50.2%
18
77%
107%
Sunshine Village, Alb. 7,028
-22.5%
-52.2%
54
84%
112%
Mt. Rainier Paradise, Wash. 5,420
-21.4%
-46.5%
57
86%
115%
Mt. Baker, Wash. 4,300
-18.5%
-48.8%
54
87%
113%
Mt. Hood Meadows, Ore. 5,400
-18.5%
-48.6%
35
88%
113%
Jackson Hole, Wyo. 8,250
-19.5%
-45.5%
57
88%
113%
Fernie , B. C. 5,400
-18.1%
-47.8%
35
84%
109%
Schweitzer, Idaho 4,710
-19.3%
85%
109%
Mt. Bachelor, Ore. 6,350
-17.8%
-33.6%
51
91%
114%
Stevens Pass, Wash. 4,062
-15.0%
-41.2%
32
87%
111%
Mt. Norquay, Alb. 5,350
-12.8%
-21.8%
20
82%
107%
Lake Louise, Alb. 6,710
-15.6%
-36.5%
55
87%
107%
Mt. Fidelity (Selkirks), B. C. 6,150
-17.1%
-46.5%
55
88%
107%
Bridger Bowl, Mont. 7,100
-18.2%
-37.5%
22
84%
103%
Teton Pass, Wyo. 8,000
-26.2%
Mildly
favored by La Nina
Steamboat, Colo. 9,200
-15.5%
-25.2%
43
88%
107%
Breckenridge, Colo. 11,100
-15.8%
-13.9%
31
90%
115%
Crested Butte, Colo. 10,150
-14.1%
87%
107%
Crystal Mtn 1, Wash. 4,400
-12.9%
86%
109%
Crystal Mtn 2, Wash. 6,100
-10.1%
-40.0%
20
90%
106%
Crater Lake (Mt. Bailey), Ore. 6,800
-12.6%
-24.3%
58
94%
111%
Whiteface (Lake Placid), N. Y. 3,680
-11.5%
-39.0%
17
88%
104%
Jay Peak, Vt. 3,000
-11.4%
-26.1%
42
86%
103%
Big Sky, Mont. 8,920
-16.3%
-37.6%
38
93%
107%
Cannon Mt., N. H. 1,800
-12.2%
-22.4%
46
95%
103%
Mansfield Stake, Vt. 3,950
-11.4%
-26.5%
51
95%
107%
Smuggler's Notch, Vt. 1,600
-11.4%
-26.6%
33
92%
106%
Snowmass, Colo. 11,000
-11.8%
86%
97%
Whitewater, B. C. 5,500
-10.9%
90%
104%
Grand Targhee, Wyo. 8,200
-12.5%
-30.2%
48
91%
103%
Brundage, Idaho 6,000
-29.1%
36
Loon, N. H.
2,000
-11.0%
Mt. St. Anne, Que. 2,000
-8.7%
Spencer's Creek, Australia 5,903
-23.6%
62